| Title | Performance Apparel Markets |
| Abbreviation | Perform. Appar. Mark. |
| Publication Type | Journal |
| Subject Area, Categories, Scope | Materials Science (miscellaneous) (Q4) |
| h-index | 8 |
| Overall Rank/Ranking | 28362 |
| SCImago Journal Rank (SJR) | 0.101 |
| Impact Score | 0.00 |
| Publisher | Textiles Intelligence Ltd. |
| Country | United Kingdom |
| ISSN | 14776456 |
| Best Quartile | Q4 |
| Coverage History | 2002-2022 |
Performance Apparel Markets is a journal covering the technologies/fields/categories related to Materials Science (miscellaneous) (Q4). It is published by Textiles Intelligence Ltd.. The overall rank of Performance Apparel Markets is 28362. According to SCImago Journal Rank (SJR), this journal is ranked 0.101. SCImago Journal Rank is an indicator, which measures the scientific influence of journals. It considers the number of citations received by a journal and the importance of the journals from where these citations come. SJR acts as an alternative to the Journal Impact Factor (or an average number of citations received in last 2 years). This journal has an h-index of 8. The best quartile for this journal is Q4.
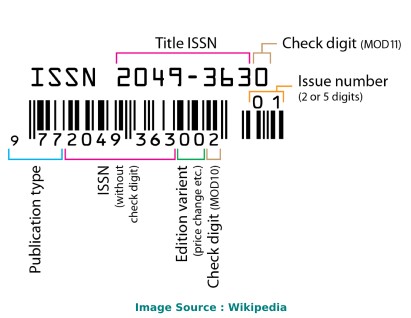
The ISSN of Performance Apparel Markets journal is 14776456. An International Standard Serial Number (ISSN) is a unique code of 8 digits. It is used for the recognition of journals, newspapers, periodicals, and magazines in all kind of forms, be it print-media or electronic. Performance Apparel Markets is cited by a total of 0 articles during the last 3 years (Preceding 2023).
The Impact IF 2023 of Performance Apparel Markets is 0.00, which is computed in 2024 as per its definition. The impact IF, also denoted as Journal impact score (JIS), of an academic journal is a measure of the yearly average number of citations to recent articles published in that journal. It is based on Scopus data.
Impact IF 2023 of Performance Apparel Markets is 0.00. If the same downward trend persists, Impact IF may fall in 2024 as well.
| Year | Impact IF |
|---|---|
| 2023/2024 | Coming Soon |
| 2023 | 0.00 |
| 2022 | 0.13 |
| 2021 | 0.14 |
| 2020 | 0.41 |
| 2019 | 0.08 |
| 2018 | 0.20 |
| 2017 | 0.88 |
| 2016 | 1.00 |
| 2015 | 0.48 |
| 2014 | 0.30 |
Performance Apparel Markets has an h-index of 8. It means 8 articles of this journal have more than 8 number of citations. The h-index is a way of measuring the productivity and citation impact of the publications. The h-index is defined as the maximum value of h such that the given journal/author has published h papers that have each been cited at least h number of times.
The ISSN of Performance Apparel Markets is 14776456. ISSN stands for International Standard Serial Number.
An ISSN is a unique code of 8 digits. It is used for the recognition of journals, newspapers, periodicals, and magazines in all kind of forms, be it print-media or electronic.
The overall rank of Performance Apparel Markets is 28362. According to SCImago Journal Rank (SJR), this journal is ranked 0.101. SCImago Journal Rank is an indicator, which measures the scientific influence of journals. It considers the number of citations received by a journal and the importance of the journals from where these citations come.
| Year | SJR |
|---|---|
| 2023/2024 | Coming Soon |
| 2023 | 0.101 |
| 2022 | 0.101 |
| 2021 | 0.104 |
| 2020 | 0.100 |
| 2019 | 0.100 |
| 2018 | 0.100 |
| 2017 | 0.100 |
| 2016 | 0.100 |
| 2015 | 0.100 |
| 2014 | 0.100 |
| Year | Ranking |
|---|---|
| 2023/2024 | Coming Soon |
| 2023 | 28362 |
| 2022 | 27176 |
| 2021 | 25140 |
| 2020 | 32347 |
| 2019 | 29845 |
| 2018 | 31234 |
| 2017 | 31970 |
| 2016 | 31799 |
| 2015 | 31488 |
| 2014 | 30884 |
Performance Apparel Markets is published by Textiles Intelligence Ltd.. It's publishing house is located in United Kingdom. Coverage history of this journal is as following: 2002-2022. The organization or individual who handles the printing and distribution of printed or digital publications is known as Publisher.
Visit the official website of the journal/conference to check the further details about the call for papers.
The IS0 4 standard abbreviation of Performance Apparel Markets is Perform. Appar. Mark.. This abbreviation ('Perform. Appar. Mark.') is well recommended and approved for the purpose of indexing, abstraction, referencing and citing goals. It meets all the essential criteria of ISO 4 standard.
ISO 4 (International Organization for Standardization 4) is an international standard that defines a uniform and consistent system for abbreviating serial publication titles and journals.
If your research field is/are related to Materials Science (miscellaneous) (Q4), then please visit the official website of this journal.
The acceptance rate/percentage of any academic journal/conference depends upon many parameters. Some of the critical parameters are listed below.
It is essential to understand that the acceptance rate/rejection rate of papers varies among journals. Some Journals considers all the manuscripts submissions as a basis of acceptance rate computation. On the other hand, few consider the only manuscripts sent for peer review or few even not bother about the accurate maintenance of total submissions. Hence, it can provide a rough estimation only.
The best way to find out the acceptance rate is to reach out to the associated editor or to check the official website of the Journal/Conference.
Performance Apparel Markets latest impact IF is 0.00. It's evaluated in the year 2023. The highest and the lowest impact IF or impact score of this journal are 1.00 (2016) and 0.00 (2023), respectively, in the last 10 years. Moreover, its average IS is 0.36 in the previous 10 years.
The Performance Apparel Markets has an SJR (SCImago Journal Rank) of 0.101, according to the latest data. It is computed in the year 2024. In the past 10 years, this journal has recorded a range of SJR, with the highest being 0.104 in 2021 and the lowest being 0.100 in 2020. Furthermore, the average SJR of the Performance Apparel Markets over the previous 10-year period stands at 0.36.
The latest h-index of the Performance Apparel Markets is 8.
The Performance Apparel Markets is published by the Textiles Intelligence Ltd., with its country of publication being the United Kingdom.
The Performance Apparel Markets is currently ranked 28362 out of 27955 Journals, Conferences, and Book Series in the latest ranking. Over the course of the last 10 years, this journal has experienced varying rankings, reaching its highest position of 25140 in 2021 and its lowest position of 32347 in 2020.
The standard ISO4 abbreviation for the Performance Apparel Markets is Perform. Appar. Mark..
Performance Apparel Markets is classified as a journal that the Textiles Intelligence Ltd. publishes.
The Performance Apparel Markets encompasses the following areas:
For a more comprehensive understanding of its scope, check the official website of this journal.
The Performance Apparel Markets is assigned the following International Standard Serial Numbers (ISSN): 14776456.
The best quartile for the Performance Apparel Markets is Q4 (2023).
The Performance Apparel Markets coverage history can be summarized as follows: 2002-2022.
| Journal/Conference/Workshop/Book Title | Type | Ranking | Publisher | h-index | Impact Score |
|---|---|---|---|---|---|
| Child and Family Social Work | journal | 8089 | Wiley-Blackwell Publishing Ltd | 75 | 2.10 |
| Journal of Education and Work | journal | 11494 | Brill Academic Publishers | 45 | 2.17 |
| Howard Journal of Communications | journal | 10151 | Taylor and Francis Ltd. | 39 | 1.66 |
| Canadian Journal of Mathematics | journal | 9072 | Canadian Mathematical Society | 45 | 0.78 |
| Rudarsko Geolosko Naftni Zbornik | journal | 13873 | 19 | 1.48 | |
| Revista de Metodos Cuantitativos para la Economia y la Empresa | journal | 22581 | Universidad Pablo de Olavide | 11 | 0.35 |
| Slovenian Veterinary Research | journal | 23576 | University of Ljubljana Press | 19 | 0.43 |
| Musicae Scientiae | journal | 6057 | SAGE Publications Inc. | 49 | 3.12 |
| Enterprise Information Systems | journal | 5453 | Taylor and Francis Ltd. | 58 | 5.36 |
| Best Practice and Research in Clinical Anaesthesiology | journal | 3425 | Elsevier B.V. | 82 | 4.83 |
| Year | Impact Score (IS) |
|---|---|
| 2024/2025 | Coming Soon |
| 2023 | 0.00 |
| 2022 | 0.13 |
| 2021 | 0.14 |
| 2020 | 0.41 |
| 2019 | 0.08 |
| 2018 | 0.20 |
| 2017 | 0.88 |
| 2016 | 1.00 |
| 2015 | 0.48 |
| 2014 | 0.30 |